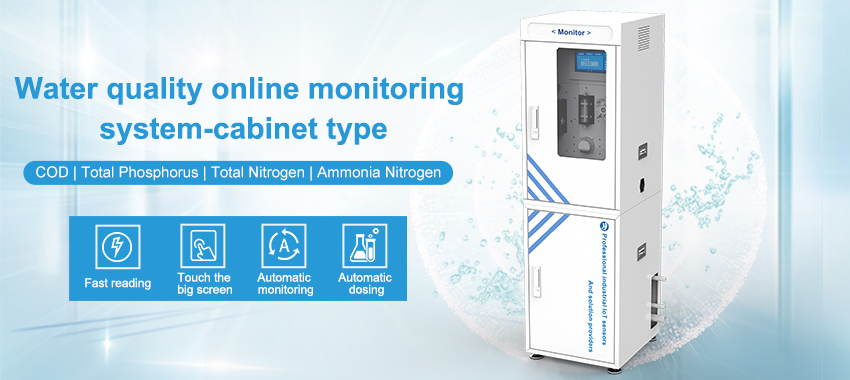
What is an online water quality monitoring system
Online water monitoring systems are an effective way to monitor water quality in real-time. These systems can provide a continuous stream of data that can be analyzed to identify trends and patterns. In this article, we will discuss the data acquisition and processing analysis of online water monitoring systems.
Data Acquisition
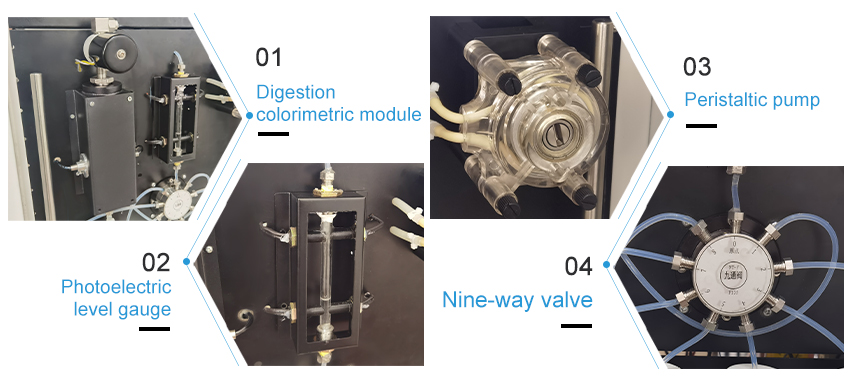
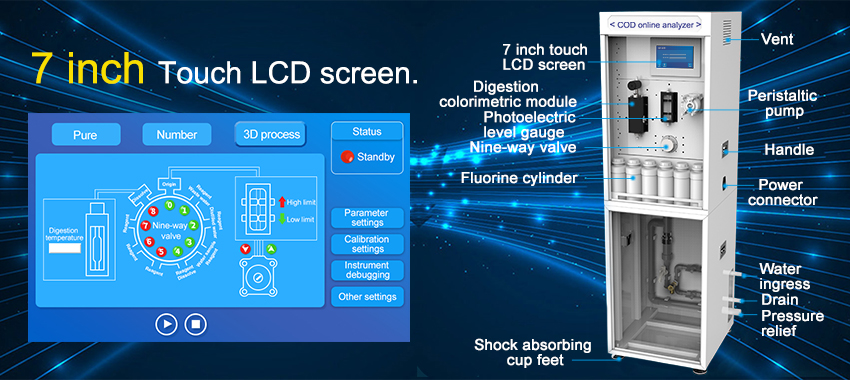
Data acquisition is the process of capturing and recording data from sensors in the online water monitoring system. The data acquisition system consists of sensors, data loggers, and communication devices. The sensors are used to measure various parameters, such as pH, temperature, turbidity, and dissolved oxygen. The data loggers are used to store the data captured by the sensors. The communication devices are used to transmit the data to a central database.
Data Processing
Data processing is the process of converting raw data into useful information. The data processing system consists of a database, data analysis software, and visualization tools. The database is used to store the data acquired by the data acquisition system. The data analysis software is used to process the data and identify trends and patterns. The visualization tools are used to present the processed data in a clear and concise manner.
Data Analysis
Data analysis is the process of examining the data to identify trends, patterns, and anomalies. There are various techniques used in data analysis, including statistical analysis, time-series analysis, and machine learning. Statistical analysis is used to identify correlations between different parameters, such as pH and dissolved oxygen. Time-series analysis is used to identify trends over time, such as seasonal changes in water quality. Machine learning is used to identify patterns in the data that are not easily observable, such as the impact of land use changes on water quality.
Example Analysis
et us consider an example of data analysis for an online water monitoring system. The system measures pH, temperature, conductivity, turbidity, and dissolved oxygen. The data is collected every 15 minutes and stored in a database. We will use statistical analysis to identify correlations between different parameters.
First, we will plot the pH versus dissolved oxygen data to identify any correlations. The plot shows a strong negative correlation between pH and dissolved oxygen, indicating that as the pH decreases, the dissolved oxygen increases.
Next, we will plot the turbidity versus conductivity data to identify any correlations. The plot shows a weak positive correlation between turbidity and conductivity, indicating that as the turbidity increases, conductivity also increases.
Conclusion
Online water monitoring systems are an effective way to monitor water quality in real-time. The data acquired by these systems can be processed and analyzed to identify trends and patterns. This information can be used to make informed decisions about water management and to take action to preserve water quality. The data acquisition and processing analysis methods discussed in this article can be used as a starting point to develop more detailed analysis techniques for specific water quality parameters.