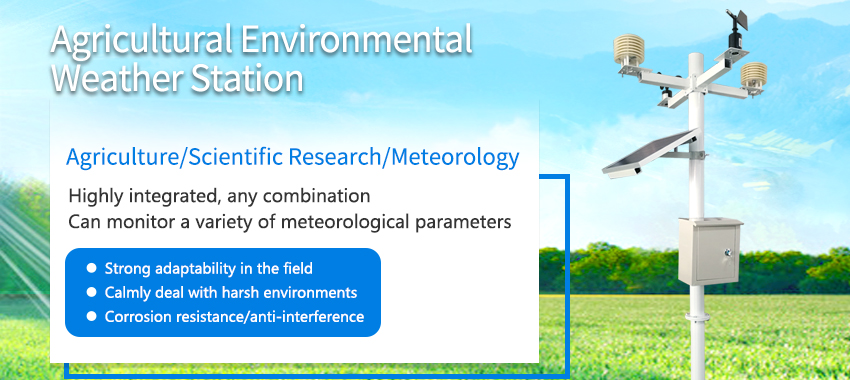
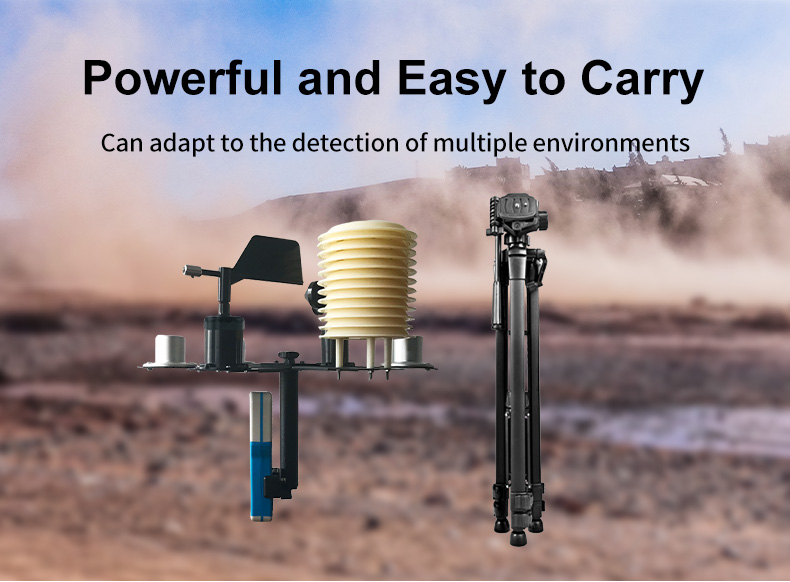
Agricultural weather station monitor environmental factors through sensors, such as wind speed, wind direction, temperature, humidity and so on.These elements are monitored by corresponding sensors, and the meteorological elements monitored by sensors are collected by collectors.

The meteorological element data collected by the collector is transmitted to the back-end computer through the traditional module.
Users can directly see the information of various meteorological elements in the background computer terminal.
Agricultural weather stations are automatic meteorological stations produced according to WMO meteorological observation standards.
Agricultural weather station consists of meteorological sensor, meteorological data recorder and meteorological environment monitoring software.
Widely used in industrial and agricultural production, tourism, scientific research, meteorology and other urban environmental monitoring.
Automatic weather station Features

1, collector:
industrial processing chip, with ABS shell. The whole is light, firm and beautiful. With 19264 full dot matrix LCD display, can complete graphics display or 124 Chinese characters display (optional 7 inch LCD display screen). Suitable for all kinds of harsh environment.
2, The automatic weather station has the function of external USB disk storage expansion.
3, sensor:
Meteorological stations can monitor environmental temperature, humidity, wind speed, wind direction, air pressure, soil temperature, soil moisture, rainfall sensor, total radiation sensor, carbon dioxide and other meteorological elements.
4, Support:
The surface of the main pole of weather station is treated by hot dip galvanizing and electrostatic spraying. We found that it has strong corrosion resistance. The main pole is 3.5 meters high and equipped with windproof cable.
5, One set of meteorological data analysis software:
Data query: Supports the query, export, and print of real-time and historical data in any time period.
Data statistics: Supports single factor statistics: Displays maximum, minimum, and average values of a single factor by year, month, day, hour, 10 minutes, or any time period.
Data chart function: real-time curve can be formed according to the collected data, and can be presented in columnar chart, pie chart and other intuitive ways.